

Fresh fish and seafood dominate the retail market in Australia, and data gathered during the COVID-19 restrictions show consumers paying more and buying a wider range of fresh product as they experiment with cooking at home. However, frozen markets have continued to see strong growth, primarily as a result of consumers seeking to shore up their food supplies in the lead-up to the national lockdown in March.
By Catherine Norwood
Key points
- In the past year the value of retail fish and seafood sales grew 7.3 per cent.
- Frozen retail sales value increased 10.8 per cent, fresh sales value grew 5.9 per cent.
- Frozen product sales by volume spiked by 26 per cent in March.
- Non-supermarket retail sales value grew 18.4 per cent in April.
Retail data from Nielsen Homescan clearly shows frozen seafood proved to be the go-to option – sales jumped by 26 per cent during March, while fresh product purchases plummeted in the same period.
It suggests opportunities for the seafood sector to enter the frozen markets with products that households can reliably have on hand to deal with whatever may come their way.
The FRDC commissioned data from Nielsen Homescan to help verify the extent of the pandemic impacts on retail sales. It adds quantitative detail to the experiences of seafood sector stakeholders – many of which are reported throughout this issue of FISH magazine. The data also reveals consumer purchasing patterns at a national level.
The commissioned data focuses on two four-week periods ending 21 March and 18 April 2020, with trends data available over the past two years.
The March reporting period includes the tightening of community restrictions in response to COVID-19. The following period included the beginning of the national lockdown and the Easter weekend on 11 to 12 April.
From a retail perspective, March demonstrated continued panic buying and pantry stocking, which had started in February. The April period saw the resumption of more normal purchasing patterns. A major contributing factor in the shift of purchasing behaviour was the closure of restaurants and increased spending on fresh food to cook at home.
The data indicates consumer thought processes around being ‘locked down’ and stocking up; fresh seafood is a ‘now’ purchase and frozen is a good future meal option.
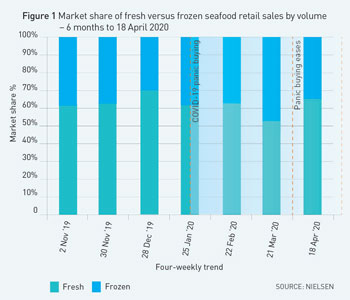
While frozen seafood sales spiked during the March period, fresh seafood sales surged to a similar extent in the April period as consumers swapped from one type of product to another (Figure 1).
This suggests overall seafood demand is relatively inelastic.
Nielsen’s associate director of retail client services, Neil Moody, says the fresh fish share of sales in the four weeks to 18 April were at the highest level ever reported outside the peak Christmas period. It appears this is driven by customers purchasing fresh product to cook at home.
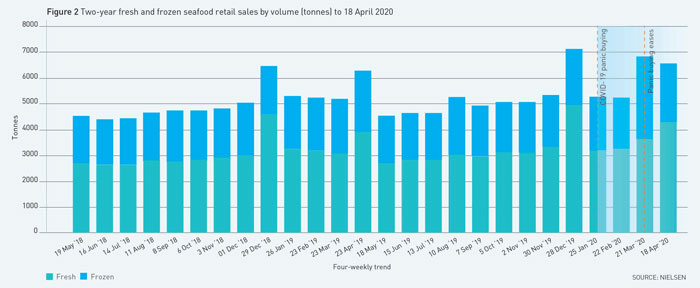
Figure 2 shows how this peak in the four weeks to 18 April compares with the Christmas peaks in 2018 and 2019, as well as to the same period in 2019.
Expanded selection
A detailed look at different seafood categories, which combines both fresh and frozen product, also shows ‘other species’ performing strongly across both reporting periods, gaining market share (Figure 3) and a 14.7 per cent increase in value as sales.
‘Other species’ includes fish such as Tuna, Mackerel, trout and Sardines, and Neil Moody says the strong performance of this category suggests a willingness by consumers to try something different and experiment at home during the lockdown.
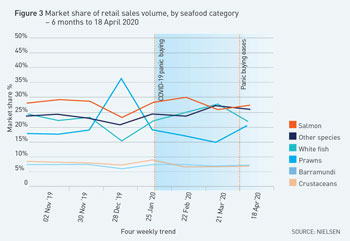
White fish, which is predominately sold as fillets and includes Basa, Flathead, snapper, Whiting and Ling, lost sales by volume during the April reporting period after a peak in March, but the value of sales continued to increase by six per cent compared to last year.
The comparison is based on a moving annual total, with sales averaged across the past 12 months against the same time the previous year.
Atlantic Salmon has maintained the largest market share by value, at 39.2 per cent, followed by prawns at 20.6 per cent; white fish at 18.3 per cent; other species at 13.7 per cent; Barramundi at 4.6 per cent; and crustaceans, mussels and Squid with a combined 3.6 per cent.
Neil Moody says Barramundi is also showing strong growth of 13.3 per cent in value and 11.9 per cent in volume over the past year. The frozen Barramundi category showed even faster growth in the April reporting period, as households increased overall consumption and continued to buy this species more often, although fresh product sales dropped more than 14 per cent.
Frozen prawns also showed faster growth in April, 13.7 per cent, driven by higher prices, with more households continuing to choose frozen product. There was a rebound of fresh prawn consumption coinciding with the Easter period.
The growth of frozen Atlantic Salmon sales also remained strong in April, up 14.4 per cent versus a year ago.
Seafood sales outlets
The growth of sales from specialty seafood channels also increased during April – at four times the rate of supermarket sales, although from a much lower base.
The 12-month average to 18 April shows supermarkets captured 84.4 per cent of sales by value, with 16.4 per cent of sales through other outlets.
During April, other outlets increased their market share more than three points, to 19.5 per cent, although the supermarkets continued to dominate with the remaining 80.5 per cent of sales.
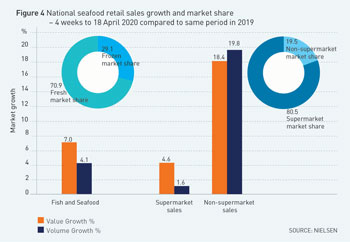
The increased market share for specialty stores was reflected in sharp sales growth – 18.4 per cent by value and 19.8 per cent by volume during the April period. Supermarket sales grew 4.6 per cent by value and 1.6 per cent by volume during the same four weeks.
National growth
Across the 12 months to 18 April, combined fresh and frozen retail sales averaged growth of 7.3 per cent in value and 6.9 per cent in volume.
In the four weeks to 21 March, when frozen seafood sales jumped, the growth of all fish and seafood sales was 7.5 per cent for both value and volume, compared to the same four-week period a year earlier.
The growth rate in the four weeks to 18 April was lower, at 7.0 per cent in value and 4.1 per cent in volume compared to the same four-week period in 2019, but showed increased prices being paid (Figure 4).
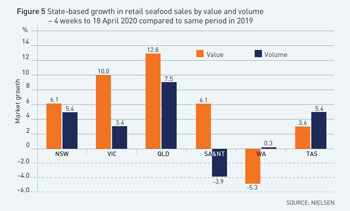
Neil Moody says the April data shows Queensland is leading the way – value increased by 12.8 per cent during the four-week period, while volume increased 7.5 per cent.
Western Australia is an anomaly in the rising value trend, with a decline of 5.3 per cent despite the volume of sales rising slightly, which reflects reduced sales of Atlantic Salmon as a result of freight restrictions (Figure 5).
Across the fish and seafood category, whole frozen seafood has continued to lead growth during the past year, incorporating both the pre-lockdown spike and the following drop in sales.
As at 18 April, average frozen product retail sales were increasing more quickly than fresh sales in terms of value, with growth of 10.8 per cent and 6.3 per cent by volume across the previous 12 months.
In the same period, sales of fresh seafood had increased 5.9 per cent by value and 7.3 per cent by volume.
Data sourced from Nielsen Homescan – Australia includes a consumer panel of 10,000 households, which are demographically and geographically representative of Australian households. Each household electronically records its household purchases of all grocery goods, fresh and packaged, and continuously reports domestic purchases from all retail outlets.