The world is increasingly volatile, uncertain, complex and ambiguous. Sometimes it can be difficult to work out where you are, and where you need to be. Maps help us to understand our surrounding landscape better, and our position within it.
System maps are no different: each one helps us to understand the system it describes, its components, and how they relate to each other. In developing the FRDC R&D Plan 2020-2025, the FRDC worked with leaders and innovators from across the wild harvest, recreational, Indigenous, aquaculture and post-harvest sectors to develop a system map of fishing and aquaculture in Australia.
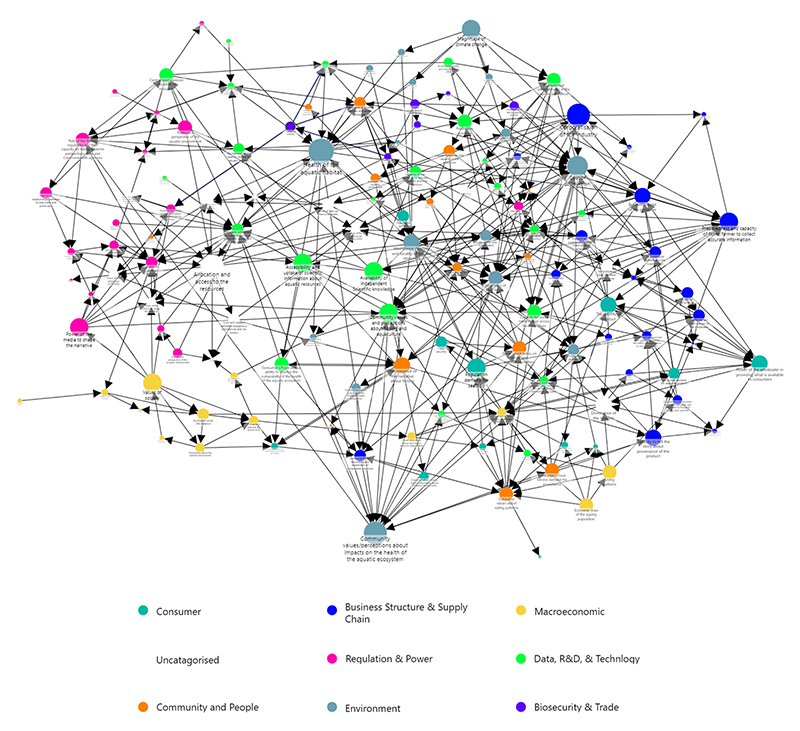
This system map illustrates the complex systems behind Indigenous, commercial and recreational fishing and aquaculture in Australia and how the elements are connected. Click on the image to view a larger version.
By building this map of the fishing and aquaculture system together and making it freely available for anyone to explore, we hope to develop a better shared understanding of the complex system we all operate in, and the unique perspectives of each sector that makes up our diverse fishing and aquaculture community.
The map shows the issues affecting our sector, sector drivers (the coloured nodes), and the relationships between each driver (the lines between the coloured nodes). Drivers that are more connected with other parts of the map are larger. If something were to happen to one of the larger nodes, the impacts would transmit through more of the system.
Each driver is coloured to signify the part of the system it describes. For example, drivers that relate to consumers are aqua, while those relating to data, R&D and technology are green. You can view or hide the different drivers by clicking on the relevant label in the key at the bottom of the map.


